
Understanding Car Accident Statistics in the US
Driving is an everyday activity, yet car accidents remain a prevalent concern. With millions of accidents occurring annually, understanding the statistics behind them can help drivers, safety advocates, and insurance companies take proactive measures to improve road safety. Car accident statistics are a key component of health statistics, providing essential data for public health analysis and helping to identify trends in motor vehicle safety. While car accident statistics differ significantly across countries due to varying regulations and road conditions, this article will focus on the U.S. It explores insightful U.S. car accident statistics, discussing their causes, consequences, and prevention strategies. After a collision, it’s crucial to file a comprehensive report detailing the incident to support data collection and future prevention efforts.
The Cold Hard Facts and Statistics About Car Accidents
The average number of car accidents in the United States each year is staggering, reaching about 6 million. These figures are estimates derived from national data-collection systems and reflect broader trends rather than exact counts. These incidents highlight the risks of driving and underscore the importance of vigilance and caution on the road. Accidents affect not just the individuals involved but also the community and economy. Each collision reminds us of the potential consequences and the need for ongoing education and safety initiatives.
Every day, more than 116 people lose their lives to car accidents, a sobering statistic that underscores the need for improved safety measures and awareness. Fatality and injury rates are calculated using standardized methods to ensure consistent and accurate reporting. These fatalities are not just numbers but represent lives cut short and families forever changed. By understanding these figures and reviewing comprehensive incident reports, we can better advocate for safer roads and policies.
Nearly 2.3 million people sustain injuries in car accidents annually in the U.S. These injuries range from minor to severe, often resulting in long-term physical and emotional impacts. For drivers, passengers, and pedestrians alike, these numbers highlight the potential consequences of risky behaviors on the road. Accurate incident reports help convey the severity of these incidents and support more effective safety measures.
Pedestrian Safety and Traffic Accidents: The Role of Weather Conditions
In 2022, 7,522 pedestrians were killed in car accidents across the U.S. This alarming figure calls for a renewed focus on pedestrian safety, including measures such as better crosswalk visibility, lower speed limits in high-foot-traffic areas, and increased public awareness campaigns.
Pedestrians are among the most vulnerable road users, and city planners and policymakers should prioritize their safety. Motorcyclists also face significant risks and benefit from infrastructure improvements designed to protect all vulnerable road users, such as safe crossing points and traffic-calming measures. By implementing effective infrastructure improvements and encouraging responsible driving habits, we can work to reduce pedestrian fatalities and create safer communities.
The impact of pedestrian fatalities goes beyond the immediate loss of life, affecting families, friends, and entire communities. Raising awareness and prioritizing pedestrian safety is crucial in preventing these tragedies and ensuring everyone can travel safely on foot.
Demographics, Population, and Accident Rates in U.S. Car Accidents
Car accident statistics reveal that certain demographic groups face higher risks on the road. Age is a significant factor: young drivers, particularly those aged 16 to 24, are consistently involved in a higher percentage of motor vehicle crashes compared to other age groups. Inexperience, risk-taking behaviors, and a greater likelihood of distraction contribute to these elevated rates. On the other end of the spectrum, older adults—especially those over 65—also experience increased crash and fatality rates, often due to age-related declines in vision, reaction time, and health. Comprehensive incident reports play a vital role in highlighting these demographic trends, guiding targeted interventions to enhance road safety for all age groups.
Crash data also show gender differences. Males are involved in more fatal crashes and account for a higher proportion of motor vehicle deaths than females. This trend is attributed to factors such as higher average miles driven, greater likelihood of engaging in risky behaviors like speeding or impaired driving, and differences in vehicle choice. However, females are more likely to be injured in crashes, reflecting differences in crash circumstances and vehicle use. Studying these gender disparities can reveal specific risk factors and help develop targeted interventions.
Population density and location also play a role. Rural areas, despite having fewer vehicles and lower populations, often experience higher fatal crash rates per vehicle mile traveled than urban areas. This is due to factors such as higher speed limits, longer emergency response times, and less consistent seat belt use. Data from a cross-regional survey can shed light on these differences, helping policymakers tailor solutions effectively.
Understanding these demographic trends is essential to target safety campaigns, adjust speed limits, and develop policies that address the unique risks faced by different driver groups. By analyzing accident rates by age, gender, and location, the Department of Transportation and its partners can create more effective strategies to reduce fatalities and injuries on U.S. roads. A comprehensive study of these factors will strengthen the foundation for safety measures.
The Life-Saving Power of Seatbelts in Motor Vehicle Crashes
In 2022, half of the 25,420 passenger fatalities involved individuals not wearing seatbelts. This statistic powerfully reminds us of the life-saving potential of seatbelt use and the need to comply with and enforce seatbelt laws. The seatbelt remains one of the most effective tools for preventing fatalities in car accidents. Ongoing surveys can gauge seatbelt use rates and provide valuable feedback for safety initiatives.
Seatbelts reduce the risk of death by an impressive 45%, showcasing their effectiveness in protecting vehicle occupants during crashes. Notably, more than half of fatally injured occupants in side and rear crashes were wearing a seat belt, highlighting the ongoing need for safety improvements even among those who are restrained. By ensuring everyone in the vehicle is buckled up, drivers can significantly increase their chances of surviving an accident.
In addition to reducing fatalities, seatbelts cut the risk of serious injury by 50%. The highest number of fatality-involved occupants is found in frontal impact crashes, underscoring the severity of these incidents. This means fewer hospitalizations, lower medical costs, and a quicker recovery for accident survivors. Wearing a seatbelt is a simple but essential step in protecting yourself and others on the road.
The Dangers of Being Unbuckled: The Link to Fatalities
Individuals not wearing a seatbelt are 30 times more likely to be ejected from a vehicle during a crash. Ejection is often fatal, making seatbelt use a critical element of accident survival. Many fatalities occurred because occupants were not wearing seatbelts at the time of the crash. Drivers must ensure all passengers comply with seatbelt regulations to prevent avoidable tragedies.
Educating the public about the risks of not wearing a seatbelt and promoting consistent usage can significantly reduce fatalities and injuries. Through campaigns, legislation, and personal responsibility, we can foster a culture of road safety and protection.
Seatbelt reminders, both in vehicles and through public service announcements, play a vital role in reinforcing positive habits. By keeping seatbelt use top of mind, we can encourage widespread adherence and enhance road safety for all.
The High Cost of Crashes in 2022
In 2022, car crashes resulted in 42,514 fatalities, highlighting the ongoing challenge of road safety. Each life lost represents a tragedy, underscoring the need for continual efforts in prevention and education to save future lives. Traffic fatalities, often influenced by factors such as weather conditions, play a crucial role in the overall death rate associated with road incidents. Understanding these elements can help devise more effective safety measures.
Beyond the loss of life, 1,664,598 individuals experienced non-fatal injuries due to car crashes. These injuries can impact physical health, mental well-being, and financial stability, affecting individuals, their families, and their communities. Weather conditions can sometimes exacerbate these statistics by making driving more hazardous, thus increasing the likelihood of both injuries and fatalities.
Property damage from crashes affected 4,226,677 incidents in 2022. The financial burden of repairs, insurance claims, and legal proceedings can be overwhelming, highlighting the importance of proactive measures to prevent accidents and minimize their impact. This includes traffic fatalities, as reducing them could significantly lower the death rate, which is closely monitored to gauge the effectiveness of road safety interventions.
The total number of fatalities, injuries, and property damage in 2022 underscores the overall impact of car crashes and the need for comprehensive traffic safety strategies. These strategies must consider a range of factors, including how weather affects driving conditions.
Typical Causes and Factors of Fatal Accidents
Drunk driving remains a leading cause of fatal accidents, accounting for 13,524 deaths. This statistic underscores the critical need for strict enforcement of DUI laws and the promotion of alternative transportation options for those under the influence.
Speeding accounted for 12,151 deaths, illustrating the dangers of exceeding speed limits and driving recklessly. Public awareness campaigns and enhanced enforcement can play a significant role in curbing this behavior and reducing fatalities. Weather changes can amplify the hazards of these behaviors, leading to more traffic fatalities.
Driver distraction resulted in 3,308 deaths, highlighting the need to address and mitigate distractions such as mobile device use and in-car entertainment systems. Education and technology can help minimize these risks and enhance driver focus. These car accident statistics reflect the ongoing challenges in addressing risky driving behaviors.
The Threat of Drowsy Driving and Its Link to Crashes
Drowsy driving caused 6,400 fatalities in auto accidents in 2022, emphasizing the importance of recognizing and addressing fatigue behind the wheel. Encouraging regular breaks, adequate rest, and awareness of drowsiness signals can mitigate these risks and prevent accidents. Poor weather conditions can exacerbate the dangers of drowsy driving, increasing the overall death rate associated with road travel.
Fatigue impairs reaction time, decision-making, and attention, making it a significant hazard on the road. Employers and individuals must prioritize rest and well-being to support safe driving practices and reduce drowsy driving.
Public campaigns and initiatives that highlight the dangers of drowsy driving can raise awareness and foster safer driving habits. A collective commitment to alertness and responsibility can significantly reduce fatigue-related accidents.
The Prevalence of Distracted Driving: The Role of Cell Phones
Every day, more than 9 people die due to distracted driving. This alarming trend necessitates a concerted effort to promote attentive driving and minimize distractions, particularly those involving smartphones and other electronic devices.
Driving while using a cell phone reduces brain activity associated with driving by 37%, impairing cognitive functions necessary for safe navigation. Awareness of these risks is crucial to encouraging drivers to stay focused and minimize distractions.
One out of three people admits to texting while driving, which increases crash risk by 23 times. Public education and technological solutions, such as hands-free devices and app restrictions, can help address this pervasive issue.
The Impact of Phone Use on Accidents: Addressing Distracted Driving
Phone use contributes to 12% of all car accidents on U.S. roads. Addressing this risk requires a multifaceted approach, including legislation, education, and technology, to promote safe driving habits and reduce accident rates. The combination of adverse weather and distractions further complicates safety efforts, often leading to increased traffic fatalities and a higher death rate.
Distraction accounts for nearly 1 in 5 crashes involving injuries, highlighting the need for comprehensive strategies to minimize distractions and protect road users. By staying focused and eliminating unnecessary stimuli, drivers can help make travel safer. In our fast-paced world, it’s crucial to consider the role that cell phones play in the current state of road safety.
Simple actions, such as storing phones out of reach or using voice-activated controls, can significantly reduce distraction risk. Promoting these practices across society can lead to a safer driving environment for everyone. The integration of technology into our daily lives, including cell phones, underscores the importance of maintaining focus to improve road safety standards.
The Consequences of Texting While Driving: Exploring the Link to Fatalities
Sending or receiving a text takes a driver’s eyes off the road for an average of 4.6 seconds, equivalent to driving the length of a football field blindfolded. This level of distraction poses a significant threat to road safety and requires immediate attention. In this digital age, cell phones are a major factor contributing to distracted driving incidents.
Awareness campaigns, legislation, and technology can effectively address texting while driving. By fostering a culture of accountability and responsibility, we can reduce this dangerous behavior and improve overall safety. Addressing the widespread use of cell phones while driving is critical to improving current road safety statistics.
Encouraging drivers to adopt safer practices, such as pulling over to send messages or using voice commands, can mitigate the risks associated with texting. We can work toward a future with fewer accidents by prioritizing focus and reducing distractions, especially those amplified by cell phones.
The Role of Insurance Companies in Promoting Traffic Safety
Insurance companies play a crucial role in promoting road safety by incentivizing safe driving behaviors. Through discounts, rewards programs, and educational initiatives, insurers can encourage drivers to adopt responsible habits and reduce accident rates. The influence of cell phones on driving habits is a key factor in shaping these initiatives.
By leveraging data analytics and telematics, insurance companies can offer personalized feedback and insights to drivers, improving awareness and fostering safer practices. This proactive approach benefits both policyholders and the broader community, especially in today’s driving environment, where cell phones are ubiquitous.
Collaboration among insurers, policymakers, and safety advocates can yield innovative solutions that enhance road safety and reduce accident-related costs. By working together, these stakeholders can create a safer driving environment for everyone and address the impact of cell phones on current road use.
NHTSA’s National Center: The Source Behind the Statistics Numbers
Behind every car accident statistic is a rigorous process of data collection and analysis, much of which the National Highway Traffic Safety Administration’s National Center for Statistics and Analysis (NCSA) oversees. As the primary source of motor vehicle crash data in the United States, the NCSA compiles, analyzes, and publishes comprehensive reports that inform policymakers, researchers, and the public about the current state of road safety, especially amid the widespread use of cell phones.
One of the NCSA’s most important tools is the Fatality Analysis Reporting System (FARS), a nationwide database that tracks all fatal crashes on public roads. FARS collects detailed information on each crash, including driver age, vehicle type, road conditions, and contributing factors such as alcohol or speeding. This system ensures data is consistent, accurate, and up to date, allowing meaningful comparisons and trend analysis over time, particularly regarding the influence of cell phones on current road safety.
The NCSA’s publications, such as annual traffic safety fact sheets and in-depth reports, are widely used by government agencies, safety advocates, and the media. These resources provide the foundation for setting speed limits, developing safety regulations, and evaluating the effectiveness of programs to reduce motor vehicle deaths and injuries.
By relying on the NCSA’s data and analysis, the Department of Transportation and its partners can make informed decisions that save lives and improve highway safety. Accurate, transparent reporting is essential to track progress, identify emerging risks, and ensure every effort to reduce fatalities is based on the best available evidence.
Advocating for Traffic Safety on Safer Roads and in Communities
Safety advocates are vital to promoting road safety through education, awareness, and advocacy. By raising public awareness and encouraging responsible behavior, advocates contribute to a culture of road safety and protection.
Engaging with policymakers and community leaders can lead to effective infrastructure changes and programs that prioritize safety. For example, introducing speed bumps in high-risk areas and implementing stricter seatbelt laws have been shown to significantly reduce accident rates, as supported by international organizations like the WHO. By fostering collaboration and communication, safety advocates can drive meaningful change and enhance road safety.
Creating a safer driving environment requires collective action and commitment from all stakeholders. By prioritizing safety and responsibility, we can achieve a future with fewer road accidents, injuries, and fatalities.
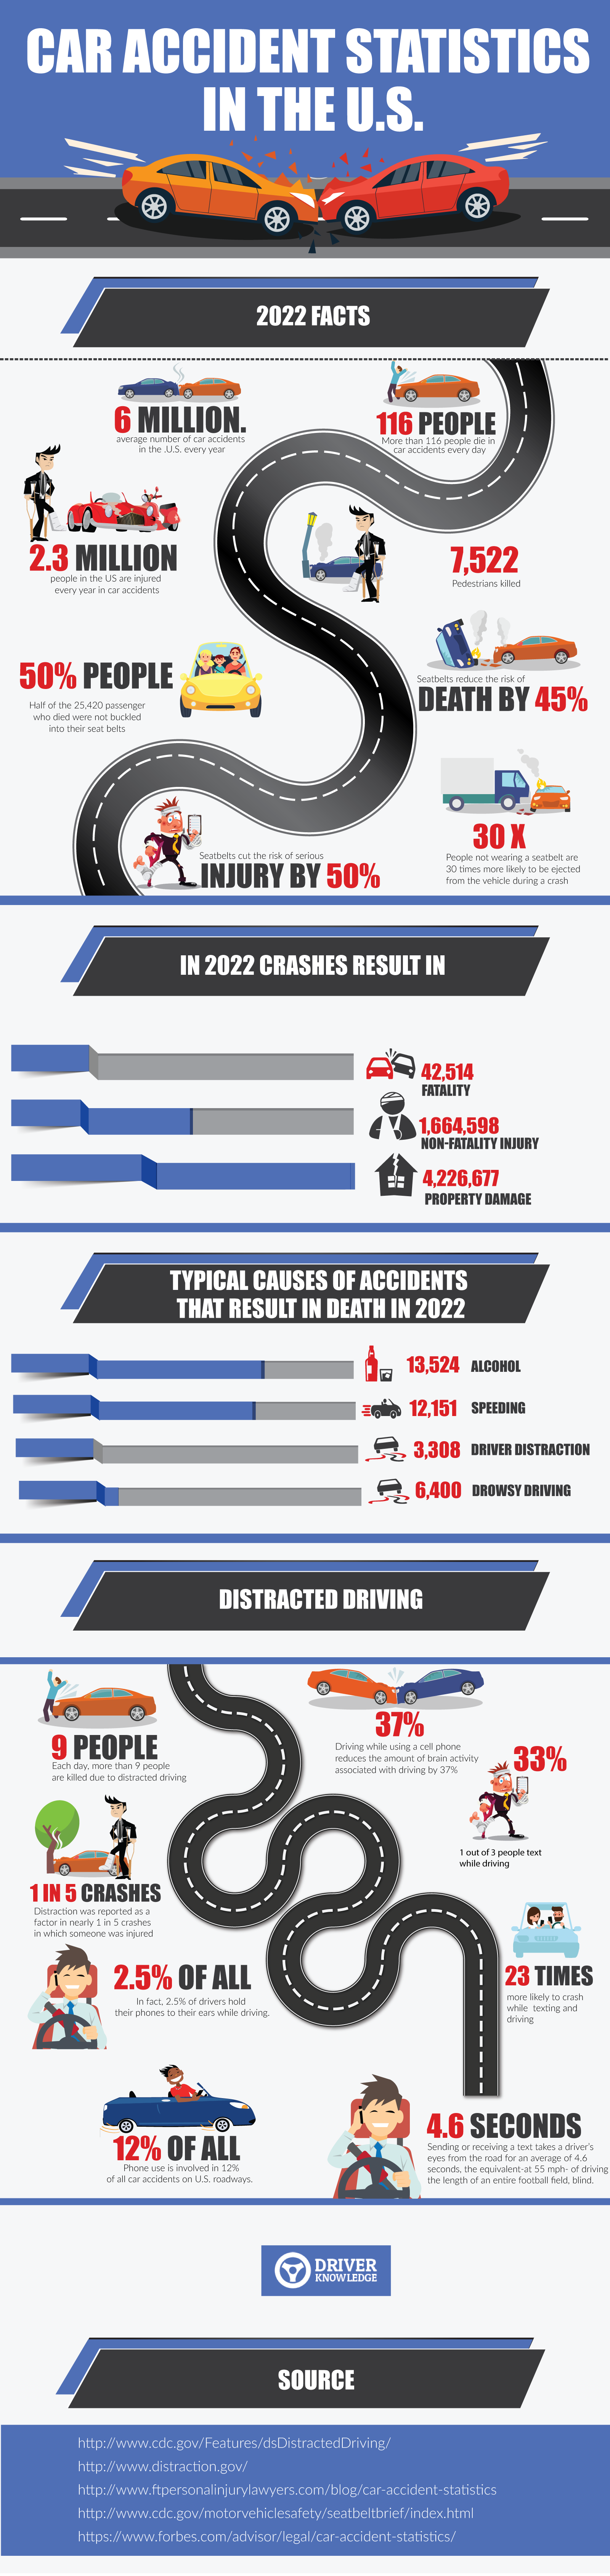
Car Accident Statistics in the U.S.
Facts
- The average number of car accidents in the U.S. yearly is 6 million.
- More than 116 people die in car accidents every day.
- 2.3 million people in the U.S. are injured every year in car accidents.
- 7,522 pedestrians were killed in car accidents in the US in 2022.
- Half of the 25,420 passengers who died were not buckled into their seat belts.
- Seatbelts reduce the risk of death by 45%.
- Seatbelts cut the risk of serious injury by 50%.
- People not wearing a seatbelt are 30 times more likely to be ejected from the vehicle during a crash.
In 2022, Crashes Result in
- 42,514 Fatality
- 1,664,598 Non-fatality injury
- 4,226,677 Property damage
Typical Causes of Accidents that Result in Death
- Drunk driving 13,524
- Speeding 12,151
- Driver distraction: A total of 3,308 deaths
- Drowsy driving. 6,400 people die in auto accidents caused by drowsy drivers
Distracted Driving
- Each day, more than 9 people are killed due to distracted driving.
- Driving while using a cell phone reduces the brain activity associated with driving by 37%.
- 1 out of 3 people text while driving.
- You are 23 times more likely to crash while texting while driving.
- Distraction was reported as a factor in nearly 1 in 5 crashes in which someone was injured.
- 2.5% of drivers hold their phones to their ears while driving.
- Phone use is involved in 12% of all car accidents on U.S. roadways.
- Sending or receiving a text takes an average of 4.6 seconds for a driver’s eyes from the road, the equivalent of driving the length of an entire football field blind.
Source
- http://www.cdc.gov/Features/dsDistractedDriving/
- http://www.distraction.gov/
- http://www.ftpersonalinjurylawyers.com/blog/car-accident-statistics
- http://www.cdc.gov/motorvehiclesafety/seatbeltbrief/index.html
- https://www.driverknowledge.com/driving-tests/
- https://www.driverknowledge.com/road-accidents-usa/
- https://www.cdlknowledge.com/truck-accident-statistics/
- https://www.forbes.com/advisor/legal/car-accident-statistics/
In Other Countries: